Gantt Charts: Visual Tools for Enhanced Project Coordination and Scheduling
Gantt Charts: Visual Tools for Enhanced Project Coordination and Scheduling
24/07/2023
Project Management
By default, effective project planning and management mean better outcomes, results, and revenue, and Gantt charts are a great management tool that helps you to organise your tasks and activities.
The latest Gantt chart software gives you even more options in the project's task management.
By answering the following questions, we will help you learn developed information about Gantt charts, their usage, and the commonly used way to represent Gantt charts.
What are Gantt Charts?
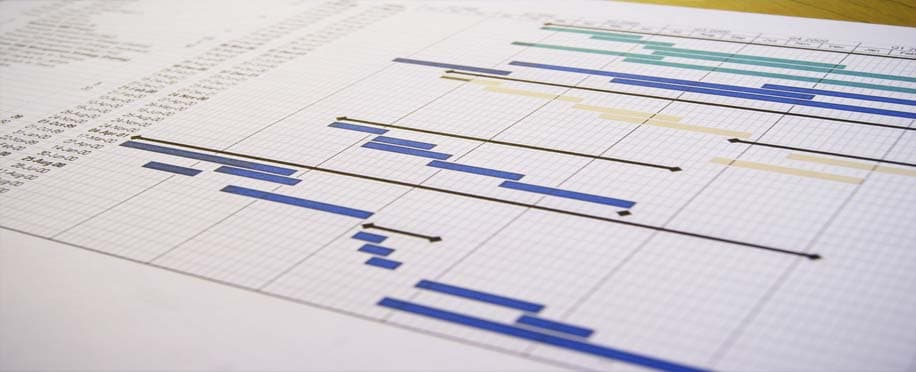
Gantt chart is a project management tool that illustrates tasks to time relation in a visual way to help you plan and schedule your project's tasks and activities based on the available timeline, events, data, and indicators.
Moreover, the Gantt chart is a horizontal bar representation tool where you can attach a graphical Gantt bar for each task. Furthermore, after all the development in Gantt chart software, you can now add and track more details to each Gantt bar, including resources, dates, responsibilities, and attached tasks.
On the other hand, having the required knowledge in engineering project management skills or any other industry type is essential to create a powerful Gantt chart.
What are Gantt Charts Used for?
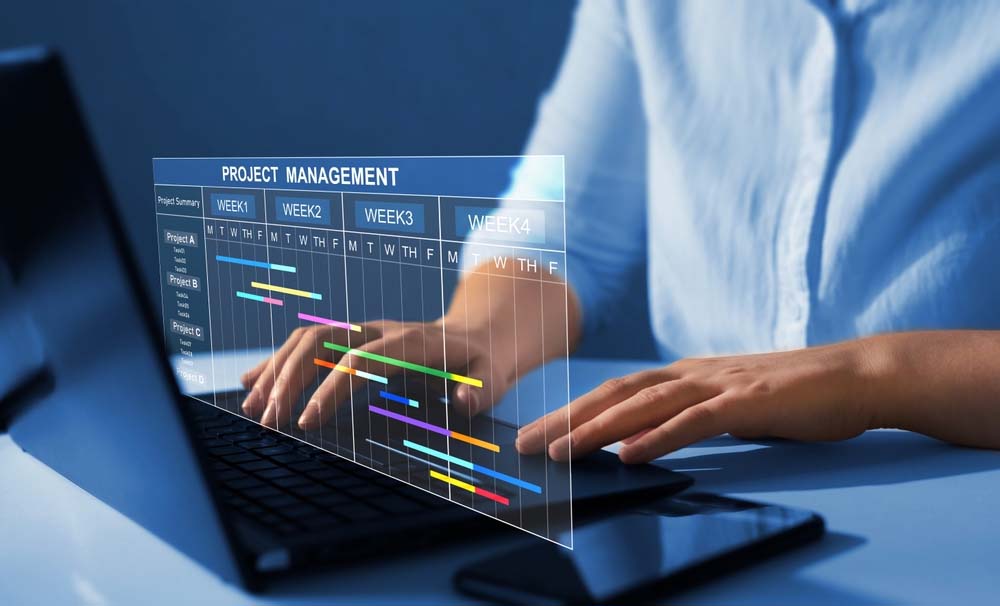
Gantt charts show a clear visual status of the ongoing work to help managers know and schedule what to do and when.
To be more explicit, we are going to share with you these basic usages of Gantt charts:
-
Clarifying task dependencies based on schedule, resources, and responsibilities.
-
List the responsible employee for each task.
-
Schedule the start point, endpoint, and task progress.
-
Illustrate all the project tasks against the timelines with unadorned vertical and horizontal axes.
How to Create Gantt Charts?
It is time to share the steps needed to create Gantt charts. These are the famous steps that all professional project management courses in London share with their students:
-
Study Your Project:
The first step in creating Gantt charts is understanding your project, the available resources, the specific days, the working teams, and the planning statutes.
Understanding and collecting all data will help you plan your project and build an effective Gantt chart for your tasks.
-
Schedule Your Project Activities:
After knowing all the related data, it is time to organise your project activities, with a unique bar for each task.
However, divide your project into precise tasks to keep the workflow effective, as too many or too few will make your designed Gantt charts just an inefficient tool.
-
Identify Tasks Sequence:
As all these tasks are attached to one project, the sequence is a must, as for sure, one study will rely on the other progression to start. Thus, you must consider this when managing your Gantt bars to create interactive project management charts.
-
Evaluate Your Resources:
Resources control every detail in the project management plans; if you have good resources, you can function several tasks simultaneously. But you will work a task-by-task system if you do not have one. And that will impact your whole management plan and the project's duration.
-
Estimate the Timeline:
By tracking your resources, you can effectively manage the time between starting and ending each task to plan the project management phases. Moreover, you must consider emergencies and delays that could affect each taskbar time and the entire work calendar.
-
Create the Gantt Chart:
After knowing all the previous details, you can start creating the completed Gantt charts by turning each task into a Gantt bar layout with all the main attached details. And remember to define a critical sequence.
Considering all that was listed will help you to design realistic management charts. However, remember to develop and update your Gantt charts based on the latest indicators and final changes during the planned project.
Eventually,
Gantt charts will help your management and planning process for each project and your business.
Thus, update your team management skills and use Gantt charts to improve your management technique and gain better outcomes.
Related Articles
7 Ways Kanban Agile Methodology Can Improve YOUR Business
7 Ways Kanban Agile Methodology Can Improve YOUR Business
Read More
Your Complete Guide to the 5 Project Management Phases
Your Complete Guide to the 5 Project Management Phases
Read More
How Building Information Modeling (BIM) Has Revolutionized the Evolution of Architectural Design
How Building Information Modeling (BIM) Has Revolutionized the Evolution of Architectural Design
Read More