Subscribe to our newsletter
Copyright © 2026 lpcentre.com All Rights Reserved. London Premier Centre For Training Ltd Registered in England and Wales, Company Number: 13694538
version: 3.0.1
Subscribe to our newsletter

Time Series Analysis Techniques: From Basics to Advanced Methods
Time series analysis is one of the best econometrics used to track, control and analyse essential data models in the financial world of economics. This technique helps a lot of data scientists and machine learning experts daily.
In this article, we will discuss the term time series analysis and how it's measured and utilised today.
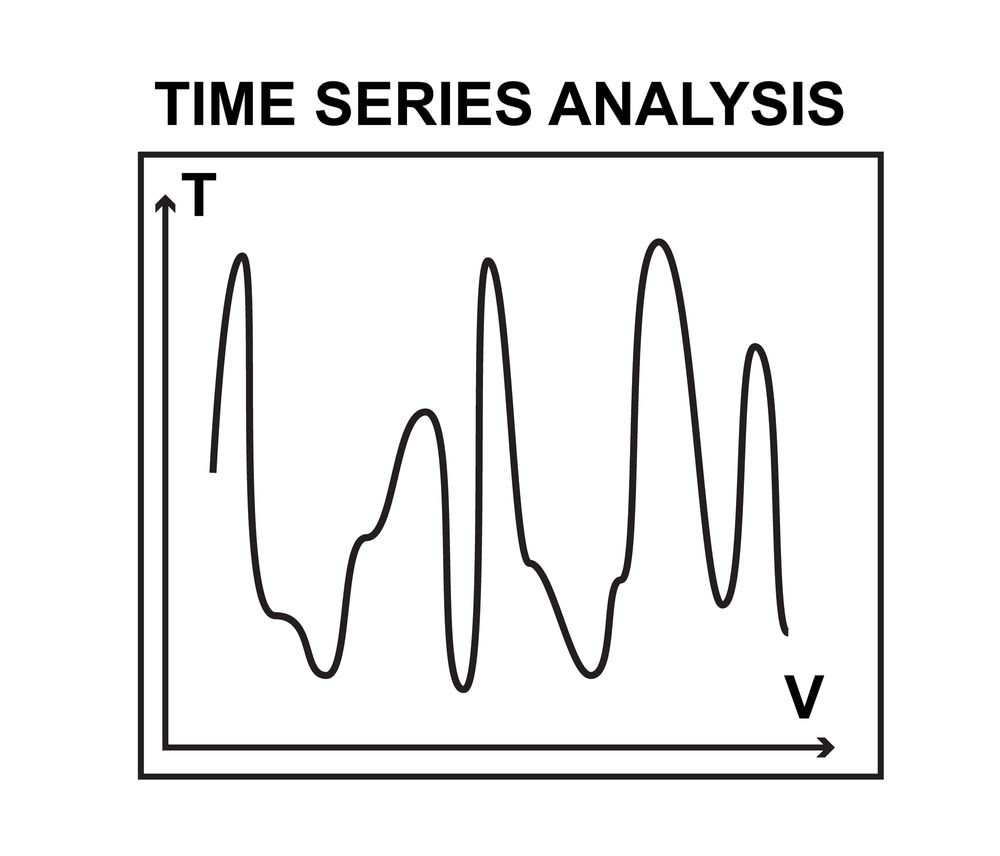
A time series can be defined as a sequence of values collected at time intervals. Sounds complicated. Let's oversimplify it together. A time series is a bunch of data scattered on an XY coordinate that forms patterns or shapes for data analysts to examine and analyse.
So, in simpler terms, we collect data over time, throw it out on a graph, and hope it forms a meaningful pattern, and that's a time series: A dataset of variables of temporal value, temporal being a keyword here, because, unlike any other collection of randomised data, time is of statistical significance here.
Why is that? Why do we choose to create a "time" series? When you space out your observations over time, meaning you look into the past and the present and how this data has changed through time, forecasting what this data will turn into in the future becomes easy work.
That's the main goal behind time series analysis (TSA). It is analysing a variable over some time to predict the outcomes of said variable in the future based on historical measurements and analysis.
Predicting what will happen in the future is a complex and complicated process. Statistics make that process easier.
Learning how to read and understand the characteristics of datasets and extract business ideas through a diploma in data science can have significant economic value in decision-making and data analysis.
Now, how does that relate to time series analysis? Here’s how:
When we look at the decomposition of the time series, we can find three standard components, these include:
The trend component: When it comes to trends, data is typically indexed in a single line that goes up or down. In the case of a movement, it's straightforward to forecast the future result because it follows a linear pattern.
The seasonal component: Understanding the seasonal part is simple through examples and applications. Think of the number of mistletoe purchases in a year; you can see the spike going up right before Christmas as the purchases increase.
The cyclical component: where the same pattern is repeated through a timestamp, for example, sales go up and down and up and down. This type of pattern also makes predictions easy if the designs are observed correctly.
These types of components show the predictive essence of time series analysis. That's because they make identifying autocorrelation in a set of variables and isolating independent ones easier. After all, they show up as clear sequential patterns in the data, and if you train to see these patterns in data, you immediately take a step up in your data analysis expertise.
How does one create a time series analysis? Here’s how:
Time series analysis can be divided into descriptive, predictive and diagnostic. These methods can be conducted through a series of data analysis tools and are helpful for statistical experts who want to get a better view of data.
Let’s get to know these methods together:
Descriptive methods describe the data, including its characteristics and properties. This can include autocorrelation and spectral density.
Predictive methods involve forecasting future events based on previous data in the time series. This method allows forecasting involving statistical models such as linear regression or non-linear models such as ARIMA.
The best part of these methods is that they can predict future values based on past importance in the time series and other factors, such as seasonal patterns and outliers, which can make business decision-making through data analysis more accessible and more efficient.
Diagnostic methods involve examining past data to find patterns that may indicate a change in underlying trends or relationships in the data set.
Now that we have learned about the different categories and techniques of time series analysis, it’s time to learn about the most essential model of time series analysis, the ARIMA model.
This model is called a univariate model of time series analysis methods, and it integrates three components:
The first one is called the Autoregressive (AR) component, which focuses on the relationship between values in a time series at different points in the past.
Now let’s move on to the second component, the integrated (I) component: This component deals with how much each value in a time series depends on its past values and not on other matters.
Now for the last component, the Moving average (MA) component: This component includes how much each value in a time series depends on the average of previous deals, where the average is recorded over some time (such as 30 days).
Time series analysis allows you to optimise your data management digitally, analyse your past results and make reasonable predictions for the future. That’s why every company needs to grasp this concept well today.
No Related Articles Yet.


